Guide to Optimizing Business Decisions Using Web Data
In business, making data-driven decisions is essential. Here’s a guide to help you understand how data can influence your business decisions effectively.
1. Establish your business objectives
The first step is to clearly define your business objectives.
For example, you might want to increase your leads by 25%. These objectives must be S.M.A.R.T. (Specific, Measurable, Achievable, Realistic, and Time-bound) to ensure their effectiveness.
2. Gather Relevant Data
The next step is collecting the right data. This can be done by conducting surveys, evaluating customer feedback, leveraging social media platforms, or using business intelligence tools like Google Analytics.
Ensure your website is connected to Google Analytics and that your account is set up for the new GA4version. Make sure all data collection options are enabled.
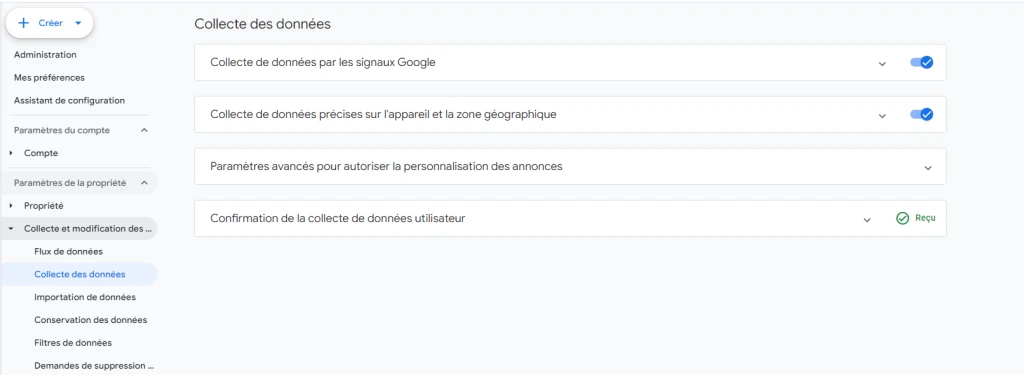
If you're already running Google Ads campaigns and haven't activated this option, campaign performance could be affected, so it's important to validate the configuration of your analytics tools.
3. Define the KPIs to track
Real, key performance indicators (KPIs) are the metrics you’ll use to measure your progress toward your goals. These could include sales data, customer churn rate, average order value, and more.
For example, if your goal is to increase leads, you might track the number of conversions generated by your Google Ads campaigns each week.
Conversions can take various forms, such as calls, in-store visits, form submissions, or Facebook messages.
Here’s a table with examples of suggested integration methods for each type of KPI:
| Examples of KPIs | Suggested integration method |
| Phone | Google Tag Manager, Javascript Code, Call Rail |
| Google Tag Manager, Javascript code | |
| Completed form | Google Tag Manager, Javascript code |
| Newsletter subscription | Google Tag Manager, Javascript code |
| Visit the Contact page | Google Analytics (GA4) |
| Add to basket | Google Analytics for WooCommerce |
| Payment incentive | Google Analytics for WooCommerce |
| Sales | Google Analytics for WooCommerce |
| Sales value | Google Analytics for WooCommerce |
The more granular your results, the better. This will help you identify which campaigns are performing well and ensure your budget is spent wisely. Tracking key performance indicators also allows for quick adjustments as needed to maintain positive outcomes.
You can also monitor other metrics like impressions, clicks, cost per click, and cost per acquisition to better understand the success of each campaign. Tracking these metrics will show you which campaigns are effective and which need improvement or discontinuation.
4. Interpret and Use the Data
Lastly, it’s vital to know how to interpret and effectively use data for decision-making.
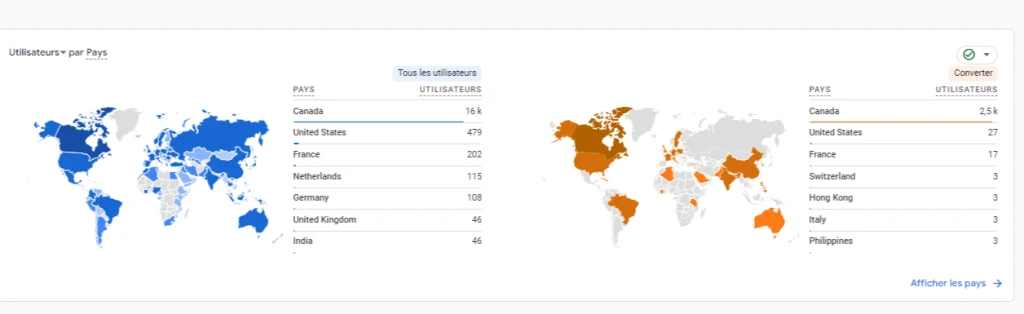
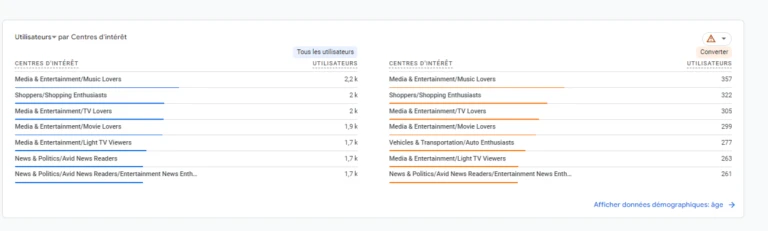
Analytics tools collect a wealth of demographic data that can help you better understand your audience and refine your online campaigns to match their interests!
Geographical data
Interests
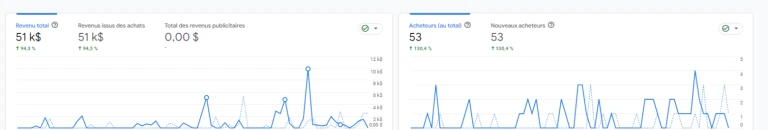
Online revenues and sales
All these charts and graphs may require some expertise to draw actionable insights, especially if you’re not familiar with data analysis. If you find it challenging to interpret your data, don't hesitate to call in a professional!